

Container vessels typically spend 1.5 to 2.5 days in port globally, with congestion pushing turnaround beyond 4 days in high-volume terminals, based on 2026 port data from hubs like Ningbo (1.72 days average wait) and Antwerp (1.32 days). Peaks hit 4+ days at congested sites like Tema, constraining berth availability and increasing demurrage costs of up to $50,000 per vessel per day. Vessel turnaround time is a direct indicator of terminal operational maturity and system-level coordination.
Reducing vessel turnaround time can increase terminal throughput by 20-30%. It slashes fuel and labor expenses, crane idle time represents a significant operational cost driver, while cutting CO2 emissions by optimizing moves. Terminals with TOS upgrades report 15-25% higher container handling rates, boosting annual revenue by reallocating berth slots to more calls.
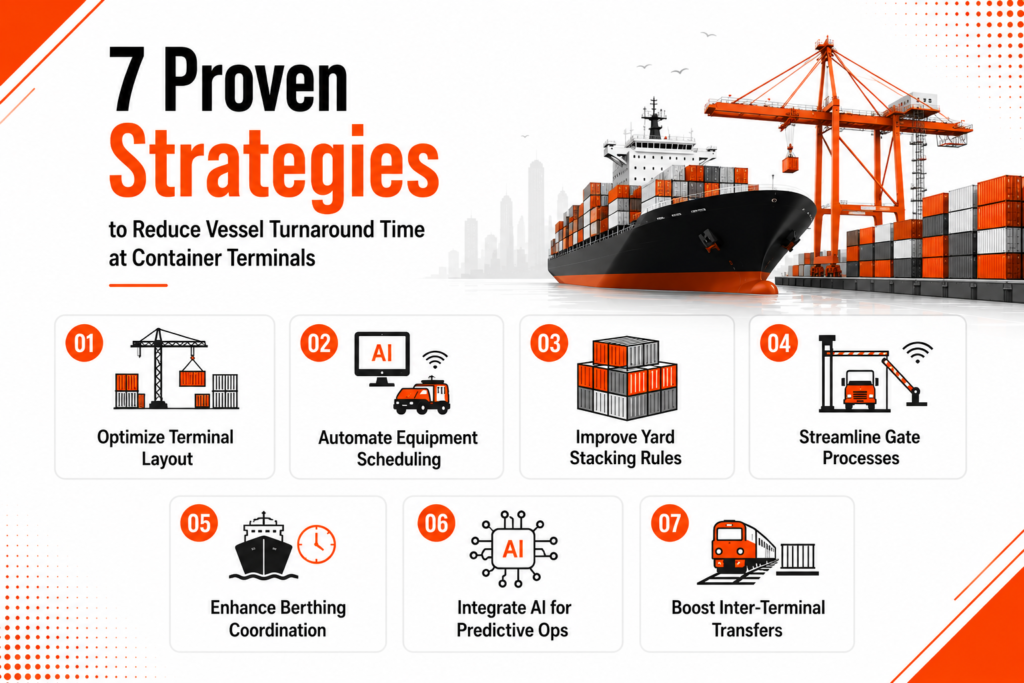
This guide outlines seven operational strategies to reduce turnaround time: optimize layouts for smooth flows, automate crane and AGV scheduling, refine yard stacking rules, streamline gate processing, enhance berthing coordination, deploy AI for predictive ops, and improve inter-terminal transfers.
Each includes steps, metrics, and case examples from top ports. Implement one to see 10-20% reductions fast, terminals using smart TOS already do. The following strategies provide actionable steps aligned to container terminal operations.
What is Vessel Turnaround Time?
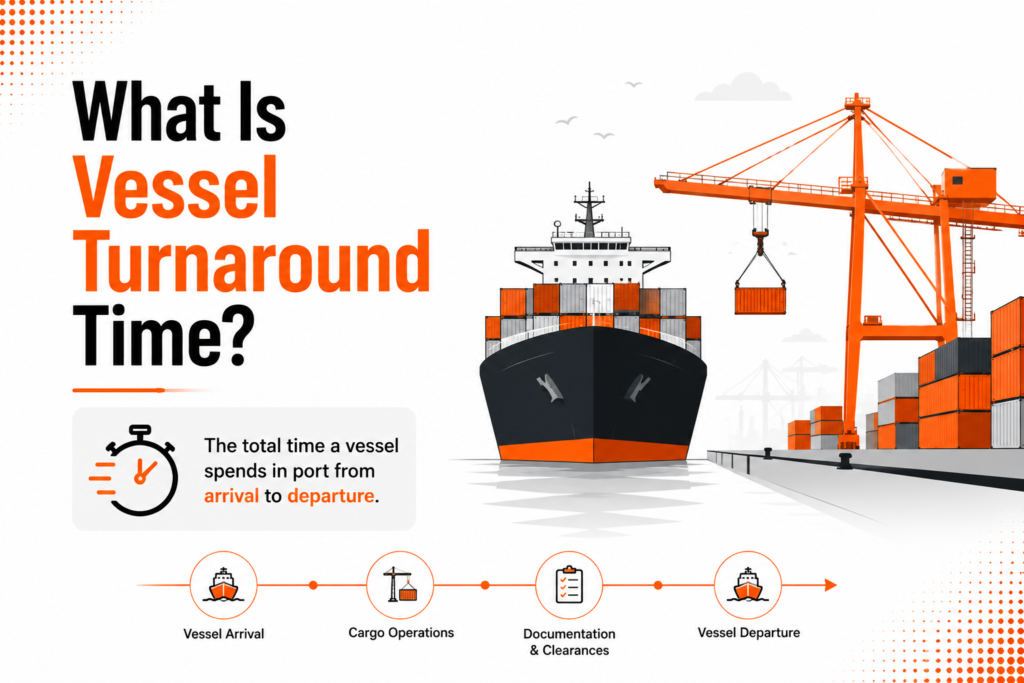
Vessel turnaround time measures the full cycle from a ship’s arrival at the pilot station to its departure after completing all port operations. It begins at vessel arrival (pilot station) and ends with departure after completion of all port operations, covering cargo handling, refueling, and clearance. In container terminals, this metric gauges operational efficiency, with global averages at 1.5-2.5 days in 2026, though peaks exceed 4 days at congested hubs.
Key components break down as follows:
Berthing: Pilotage, tug assist, and mooring; 1-3 hours typically, but delays from congestion add days.
Loading/Unloading: Crane operations move containers to/from ship; 24-48 hours for 2,000-10,000 TEU vessels, driven by quay crane rate (25-40 moves/hour).
Yard Operations: Internal transport via AGVs or trucks to stacking areas; 12-24 hours, bottlenecked by reshuffles (up to 20% of moves).
Gate Clearance: Export/import truck processing and customs; 2-4 hours, slowed by documentation queues.
| Component | Avg. Time (Efficient Ports) | Bottleneck Time (Congested Ports) |
|---|---|---|
| Berthing | 1-2 hrs (Antwerp: 1.5 days wait) | 2-4 days (Tema: 4.33 days) mykn.kuehne-nagel |
| Loading/Unloading | 24 hrs (Ningbo) | 48+ hrs (high yard use >90%) |
| Yard Ops | 12 hrs | 24 hrs (reshuffles) shipuniverse |
| Gate Clearance | 2 hrs | 4+ hrs (truck queues) linkedin |
Why Reduce Turnaround Time?
A reduction in the vessel turnaround time increases container handling capacity per berth on a daily basis, by almost 20 to 30 percent every year. For example, some big ports in India were able to cut the time it takes to turn a vessel from 96 hours in 2015 to 49.5 hours in 2025. This means they can handle containers per day going from 12,458 to 18,304 tonnes per ship berth per day.
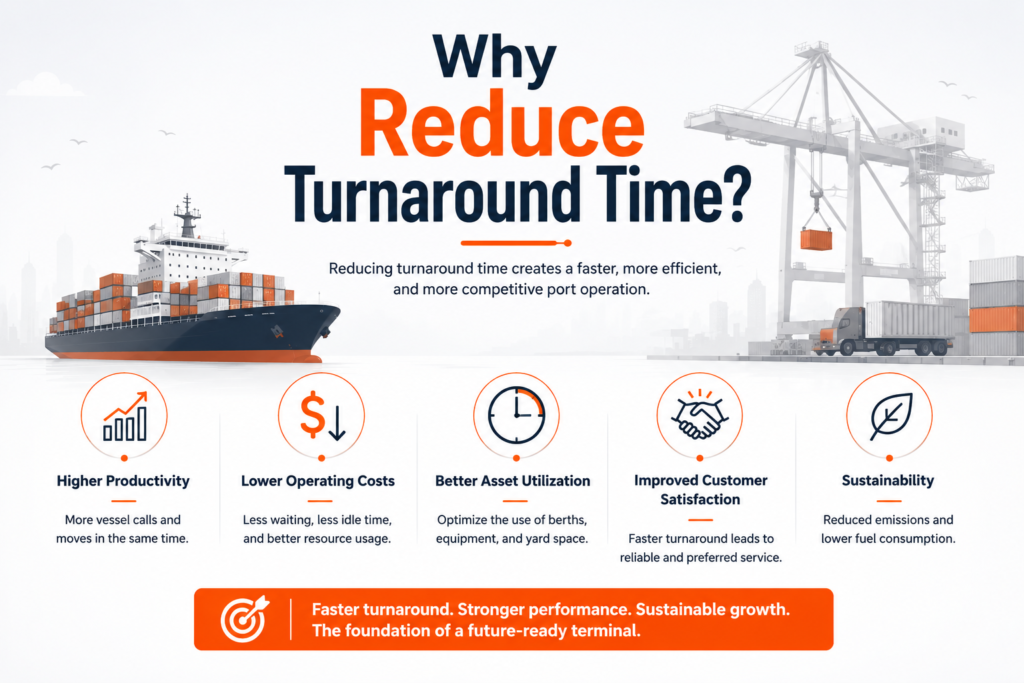
Operational costs are significantly reduced. When ships are waiting, vessels consume additional fuel during idle time, increasing operational costs and also adds time to the total delivery time. If the terminal can get the ships in and out faster they can save 15 to 20 percent on fuel and other costs. The cost of keeping a ship waiting which can be USD 20,000 to USD 50,000 per day also goes down.
The environment also benefits when a terminal is more efficient. Ships that are waiting at the terminal burn a lot of fuel which increases emissions significantly. If a terminal can get a ship in and one day faster resulting in a measurable reduction in emissions. The terminal can also save energy by making sure the cranes are working as fast as they can.
Leading ports demonstrate measurable improvements in efficiency. The port of Antwerp was able to get ships in and out 17 enabling higher vessel throughput and increased revenue potential. The port of Ningbo was able to cut the time ships had to wait by 30 percent, which meant they could handle ships without having to build more docks. Singaporean ports were able to pay for their machines in just a year or two because they were able to handle 25 percent more containers.
All of these benefits add up. When a terminal is more efficient it can handle more ships, which means it can make more money. It also means that the cost of moving goods around the world goes down which is good for everyone. In India the cost of moving goods is 13 to 14 percent of what the country makes, so if we can make that cheaper it will be good for the economy.
7 Proven Strategies
1. Optimize Terminal Layout
Terminal layout directly influences container flow between quay and yard. Stack blocks group import/export containers by vessel, voyage, and size to cut transport distances. Wider lanes (10-12m for trucks, 6-8m for AGVs) reduce operational conflicts; dedicated reefer zones near plugs reduce plug-in time by 20%. AGV paths use one-way loops with buffer slots at quay ends for smooth handoffs.
Steps:
- Map vessel plans to yard blocks for 15% less internal moves.
- Adjust lane widths and block depths via simulation to boost crane productivity 10-20 moves/hour.
- Place reefers and hazmat in outer bays to free core space.
Benefits: Cuts dwell time 20-30%, raises throughput 8-12% per berth.
Case Study: Rotterdam’s Maasvlakte II widened AGV lanes and clustered stacks, slashing reshuffles 25%. Average TRT dropped 18% to under 24 hours.
2. Automate Equipment Scheduling
AI dispatching syncs AGVs, quay cranes (QCs), and rail-mounted gantry cranes (RTGs) to minimize equipment idle time. Real-time algorithms assign tasks by proximity, battery level, and priority, using vehicle-to-everything (V2X) communication for collision avoidance. TOS integrates vessel plans with equipment pools for dynamic rerouting.
Steps:
- Deploy AI schedulers in TOS to match jobs to the nearest free unit.
- Set rules for QC-RTG handoffs under 2 minutes.
- Monitor via IoT sensors for 95% utilization.
Benefits: Drops idle time 30-40%, lifts moves per hour 25%.
Case Study: Singapore’s Tuas Mega Port automated 80% of AGVs with AI dispatch, cutting QC cycle times 22%. Vessel stays fell 20% in trials. Yields 20% TRT cut; full automation hits 30% in high-volume ops.
3. Improve Yard Stacking Rules
Dynamic stacking leverages machine learning to place containers by retrieval sequence, minimizing reshuffles (now 15-20% of moves). Rules factor dwell time, weight, size, and destination; simulations test configs pre-rollout. Hybrid blocks separate hot (export-ready) from cold (import) zones.
Steps:
- Predict dwell via ML on historical data for first-in-first-out stacks.
- Limit stack height to 5-6 high for stability; use ground slots for oversize.
- Run daily sims to tweak rules, cutting reshuffles below 5%.
Benefits: Saves 25% yard transport, boosts QC rate 15%.
Case Study: Long Beach applied dynamic rules in TOS, reducing reshuffles 40%. Yard dwell dropped 1.2 days, aiding 12% throughput rise.
4. Streamline Gate Processes
Digital check-ins via apps and OCR scanners reduce truck turnaround time from hours to minutes. Centralized plazas group import/export lanes; truck appointment systems (TAS) slot arrivals to match yard availability. Blockchain verifies docs in seconds.
Steps:
- Roll out mobile TAS with real-time slots tied to vessel plans.
- Use AI for gate OCR and predictive queuing.
- Build dedicated export plazas to split flows.
Benefits: Trims gate time 60-70%, eases yard congestion 20%.
Case Study: Hamburg’s digital gates with TAS cut truck TAT 50% to 22 minutes. Overall TRT fell 14% amid peak volumes.
5. Enhance Berthing Coordination
Predictive TOS scheduling forecasts arrival windows using AIS data, weather, and tides. Additional tug allocation (2-aaaaa4 per vessel depending on size) and dual-pilot ops speed mooring to 45 minutes. Dynamic windowing assigns berths by vessel size and crane needs.
Steps:
- Integrate AIS feeds into TOS for 24-hour forecasts.
- Boost tug fleets 20% for peak hours.
- Use just-in-time (JIT) arrival signals to ships.
Benefits: Cuts wait time 30-50%, frees 10% more berth hours.
Case Study: Antwerp’s JIT with TOS cut anchoring waits 35% to 1.32 days average. Berthing delays dropped 28%.
6. Integrate AI for Predictive Ops
AI forecasts arrivals, weather impacts, and breakdowns via ML on TOS data. It optimizes operations by simulating multiple scenarios per shift, auto-adjusting plans. Edge AI on cranes predicts failures, scheduling maintenance offline.
Steps:
- Train ML models on 2+ years of TOS logs for 90% accuracy.
- Run real-time sims for crane/AGV dispatch.
- Embed predictive maintenance in equipment IoT.
Benefits: Lifts efficiency 17-30%, cuts unplanned downtime 40%.
Case Study: Qingdao’s AI ops platform forecasted volumes, optimizing stacks and dispatch for 23% productivity gain. TRT fell 19%.
7. Boost Inter-Terminal Transfers
Rail/road shuttles link terminals, reducing intra-terminal transport distances by up to 50%. Standardized containers and EDI booking sync handoffs. Electrified rail hubs near gates reduce emissions 70% vs. diesel trucks.
Steps:
- Build dedicated rail spurs with auto-loaders.
- Use EDI for seamless TOS-to-TOS booking.
- Prioritize barge/rail for oversize moves.
Benefits: Drops yard dwell 25%, emissions 40-60%.
Case Study: LA’s on-dock rail boosted transfers 30%, easing yard strain. TRT improved 12% despite volume spikes.
Challenges and Solutions
High capital costs block automation upgrades like AGVs and AI-TOS systems, often USD 50-200M per terminal. Legacy system integration challenges impact up to 30% of implementation efforts to incompatible APIs. Workforce adaptation challenges impact implementation timelines, with 20-25% productivity dips during training phases. Data silos across operational systems lead to planning inefficiencies. Regulatory hurdles delay JIT berthing by 6-12 months in some ports.
Phased rollouts spread capex over 3-5 years, starting with software-only TOS tweaks for 10% gains before hardware. Vendor-agnostic platforms cut integration risks by 40% via open APIs.
| Challenge | Solution | Impact |
|---|---|---|
| High Capex ($50-200M) | Phase automation: TOS first, then AGVs; seek PPP funding. | ROI in 2-3 years, 15-20% throughput lift |
| Legacy Integration | Adopt API-based TOS upgrades like Navis N4 or CTOS. | 95% uptime, 25% faster sync |
| Staff Training | Simulator-based programs (VR/AR) for cranes/AGVs; 4-week modules. | Cuts learning curve 50%, zero downtime |
| Data Silos | Cloud TOS with IoT gateways for real-time fusion. | Reduces errors 70%, enables AI |
| Regulations | Pre-certify JIT via port authority pilots. | Speeds approvals 50%, 30% less wait |
ROI examples: Singapore’s Tuas phased USD 1B automation over 5 years, hitting 25% TRT cuts by year 3. Antwerp’s staff sims boosted adoption to 90%, yielding 17% efficiency.
Scale via pilots: Test one berth, expand cluster-wide. These fixes turn hurdles into 20-30% net gains.
Conclusion
Research shows ports using 3 or more of these tactics see a 25-40% drop in turnaround time. Begin with a structured assessment of yard operations and data systems. Introduce predictive analytics to improve planning accuracy. Track metrics like crane moves per hour and truck turnaround time weekly. Hybrid automation models can balance efficiency and operational flexibility. Trends for 2026 favor using AI on cranes for uptime and electrified rail links, for lower emissions.
Further, align with zero rules by using low-dwell stacks. Terminals that act now will have an advantage. They will handle volumes, have lower costs, and be greener.
Improving vessel turnaround time is a key lever for achieving higher terminal efficiency and competitiveness.
FAQs
What is vessel turnaround time in container terminals?
Vessel turnaround time covers the full port stay from pilot station arrival to unberthing departure. It includes berthing (1-3 hours), crane loading/unloading (24-48 hours), yard moves (12-24 hours), and gate clearance (2-4 hours). Global 2026 averages hit 1.5-2.5 days, with TOS systems tracking each phase for optimization. Efficient ports like Ningbo keep it under 24 hours via streamlined flows.
How much can strategies reduce vessel turnaround time?
Proven tactics cut TRT 20-40% overall. Layout tweaks yield 15-25%, AI dispatch 20-30%, and stacking rules 15-25%. Singapore’s Tuas Mega Port saw 22% drops with automation. Start with one for quick 10% gains, scaling to full suites for 30%+ throughput boosts without new berths.
What role does AI play in terminal efficiency?
AI forecasts arrivals, optimizes crane/AGV dispatch, and predicts breakdowns via TOS data. Edge models simulate 1,000 scenarios per shift for 17-30% efficiency lifts. Qingdao’s platform cut TRT 19% by dynamic stacking. Integrate with IoT for 95% uptime and 40% less downtime.
What are common bottlenecks in vessel turnaround?
Yard reshuffles (15-20% of moves), truck gate queues (up to 4 hours), and berthing waits (2-4 days at peaks) top the list. Congestion spikes during high volumes; TOS with ML cuts these 25-50%. Monitor crane moves/hour and yard use to spot issues early.
How to start reducing turnaround time on a budget?
Audit TOS data and yard layout first, no cost, 10% gains. Upgrade to API-based software for $1-5M, phasing AGVs later. Simulator training avoids productivity dips. Antwerp gained 17% via software alone before hardware.
Does faster turnaround cut emissions?
Yes, 1-day TRT drops equal thousands of CO2 tonnes per terminal yearly. Less idling cuts NOx/SOx 20-40%; electrified AGVs add 70% savings. Vancouver discounts fees 47% for green practices tied to quick cycles, meeting IMO net-zero goals.
