Summary
A fast-growing technology services provider struggled to keep its IT operations aligned across departments. Fragmented tools and inconsistent workflows led to delays, miscommunication, and rising service costs.
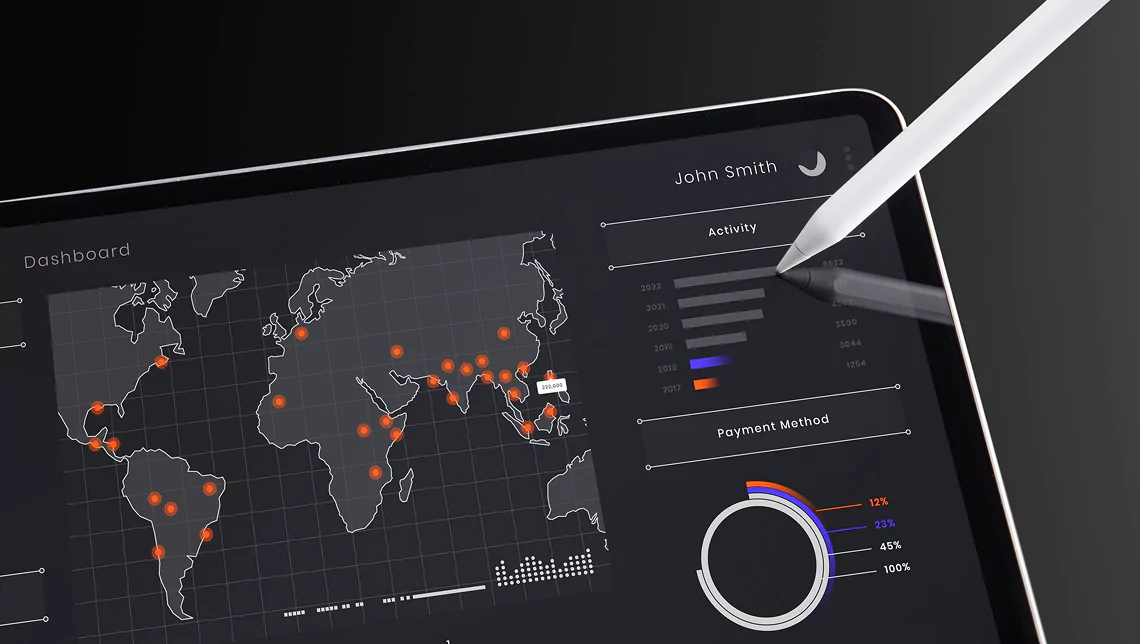
INTECH stepped in to design a custom IT Service Management (ITSM) dashboard tailored to the client’s needs. The solution brought clarity to service operations, improved collaboration between teams, and ultimately accelerated ticket resolution by 25%.
About the Client
The client is a global technology company that provides enterprise software solutions across industries. With a strong focus on digital transformation, they help customers with scalable platforms and cloud-based applications.
As their internal operations expanded, their IT support team began to face challenges caused by data spread across multiple systems and tools. Without a centralized view of ticketing, performance metrics, or historical trends, teams struggled to resolve issues quickly and
make data-driven decisions.
To fix this, the client turned to INTECH to design a custom ITSM dashboard powered by a centralized data warehouse.
Client Challenges: From Operational Inefficiencies to Lack of Visibility
As the client grew, managing IT services across multiple teams became increasingly complex. Without a shared system to track, analyze, and act on IT issues, even routine service requests became difficult to manage efficiently.
Key challenges included:
Lack of centralized visibility
The client had trouble gaining a centralized view of IT performance and workflows. Information was siloed across various teams and systems, which made it difficult to track progress and quickly identify issues in real time.
Manual processes and delays
The client managed most of their IT service tasks manually, which led to delays in ticket resolution. The absence of automation made support teams spend too much time on repetitive tasks, slowing their response to user requests.
Inefficient Communication
Communication between IT support teams and end-users was often unstructured. With no streamlined process for managing service requests or tracking progress, important updates or requests were frequently missed or miscommunicated.
This impacted the client’s ability to deliver timely IT services, causing customer dissatisfaction.
That’s when they turned to INTECH.
The INTECH Solution: Tailored ITSM Dashboard
To address the challenges, INTECH designed and implemented a fully customized ITSM dashboard. The new dashboard provided real-time insights, allowing the client’s IT teams to work more efficiently.
Here are the key features:
Centralized Dashboard
-
INTECH developed a centralized dashboard that consolidates IT data from multiple systems into one intuitive interface. This gave teams real-time visibility into ticket status, system performance, and workload distribution, helping them identify and address issues proactively.
Workflow Automation
-
INTECH automated repetitive support tasks such as ticket categorization, routing, and status updates using intelligent rules and triggers. This minimized manual effort, reduced delays, and enabled faster ticket resolution without overloading the support teams.
Streamlined Communication
-
The dashboard introduced structured request handling with built-in notifications, status tracking, and user feedback options. Teams now clearly see the status of each issue, which reduces miscommunication and improves accountability.
Implementation Process
Transforming ideas into tangible results requires precision, collaboration, and seamless execution. INTECH worked closely with the client’s IT team to ensure that each phase was carefully planned and implemented.
Here’s how we delivered:
Requirement Analysis
We started with key stakeholders to fully understand their IT service management workflows, pain points, and goals. This step ensured that the solution created addresses the client’s specific challenges and business objectives.
Design and Development
INTECH developed a user-friendly dashboard interface using HTML, CSS, and JavaScript. We integrated advanced data visualization tools to display KPIs.
Data Integration
To bring all relevant data into one place, we built secure API integrations between the new dashboard and the existing IT management system. This ensured real-time synchronization of tickets, user activity, and system performance.
Database Setup
We designed a scalable SQL-based backend optimized for performance and reliability. This allowed the solution to grow with the client’s future needs and data volumes.
Testing and Deployment
INTECH carried out extensive functional and user acceptance testing to validate system performance under real-world conditions.Once approved, we deployed the dashboard in a phased manner, ensuring a smooth transition and zero disruption to ongoing operations.
With the solution successfully implemented, the results were clear, delivering significant improvements for the client’s operations.
Key Outcomes
After the implementation of the ITSM dashboard, the client saw noticeable improvements in their IT operations.
Here are the key outcomes:
These improvements enhance the efficiency of IT operations without adding additional overhead.
Tools and Technologies Used
-
Dashboard Development (HTML, CSS, JavaScript): HTML structured the content, CSS styled the layout, and JavaScript powered interactive features. This allows IT teams to monitor and manage operations efficiently.
-
Data Integration:APIs connected the dashboard with the existing IT management systems, ensuring real-time data updates across all platforms. This reduces manual data entry and simplifies access to crucial information.
-
Data Visualization: Used advanced data visualization tools to create custom charts and graphs, which transformed raw data into actionable insights. These visuals helped teams track KPIs, identify trends, and make faster data-driven decisions.
-
SQL Database:The SQL database securely stores and accesses large volumes of operational data. This ensures the dashboard delivers real-time insights and historical data analysis without delays
Download INTECH Cuts Ticket Resolution Time by 25% with a Custom ITSM Dashboard case study from here.


